

Are you in a city that gets a Million Counts of Radiation a Week? First, how on earth are you going to find out? That is a secret, isn’t it? Radiation?
Executive Summary
The nearby Targeted Population of US nuclear power plants is 160,876,377 people by the official 2010 US Census with a measured:
2,173,286,186 [that’s Billion] CPM YTD in 2018.
See NEW DATA in the Colorado Springs, Colorado Radiation History 2006 – 2017, and the 2018 Annualized Rate of Gamma Rad.
The increase this week, July 7, 2018 to July 14, 2018 was a high 77,889,318 cpm.
This is an increase in only a week that is way too high a price to pay.
Note: It is not really 11 years, just 9 years; data was WITHHELD for 2006 and 2007, and continues to be WITHHELD by the PTB [Powers that Be]. I wonder what really happened in 2006 and 2007, don’t you?

Once emitted from the nuclear power plant, the Rad travels with the wind.
Much of it goes around the world and is detected on the West Coast of the United States.
Nuke Power Plants add to the deadly radiation every minute of every day. There are 525,600 minutes in 2018.

The Rad measured YTD in 2018 was 2,173,286,186 cpm. [in Billions]
The Rad measured YTD in 2014 was 2,139,980,246 cpm.
The increase in the YTD Rad from 2014 to 2018 YTD was 33,305,940 cpm. Written out the weekly increase was: thirty-three million, three hundred five thousand, nine hundred forty.
Dr. John Gofman, Medical Director of the Livermore Nuclear Weapons Lab famously called that kind of thing “premeditated murder.”
This nuke stuff gets real serious, real quick. It’s a nasty, nasty business.
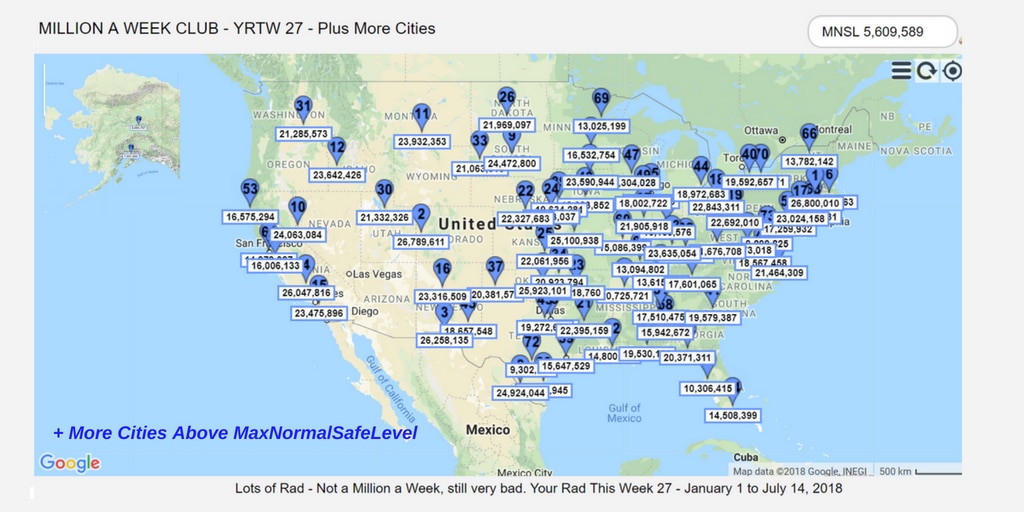
“This is a Bad situation for all who breathe,” states EU physicist Dr. Paolo Scampa.[5] Now included, for the 27th Week of 2018 just passed, all cities above 27 Million CPM [27] Year to Date [YTD] of deadly Gamma Radiation.
Gamma “Rays” unpublished radioactive kin are a disastrous freebie from the PTB [Powers that Be.] A Count is One Radioactive Decay.
NOTE TO READERS: My editorial work is solely crowdfunded via PayPal. Click here to donate>>
Thank you.
Tables of Poisoned American Cities
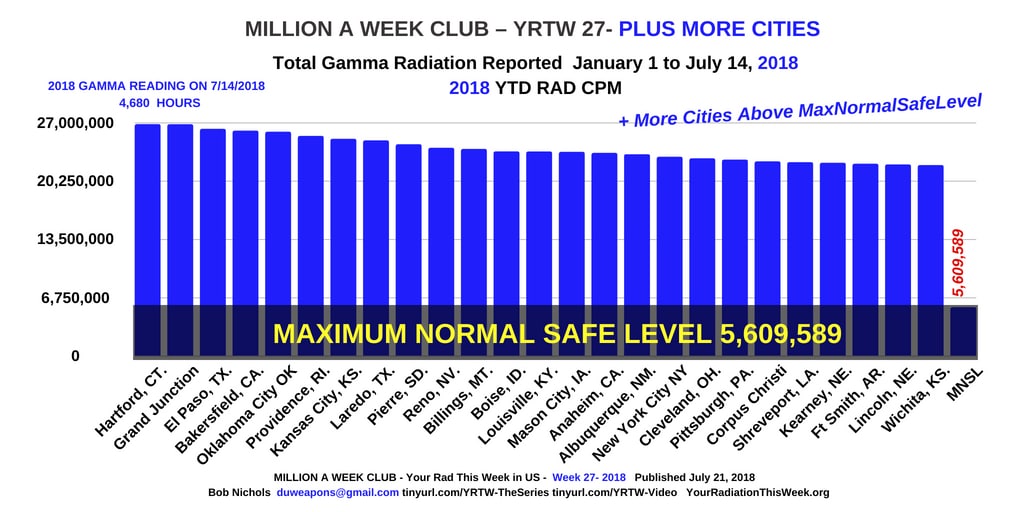
Million a Week and Total Gamma Radiation Reported in the USA – Week 27
January 1 to July 14, 2018
Published July 21, 2018
Gamma and Beta CPM by City and State in the US
+ More Cities Above MaxNormalSafeLevel
Million a Week

| 2018 GAMMA READING ON 7/14/2018 4,680 HOURS | 2014 GAMMA READING 7/14/2014 4,680 HOURS | 2018 YTD BETA CPM | DATE for 2018 Readings | CITY | ST. | 2010 Census Target Population |
|---|---|---|---|---|---|---|
| 45,039,748 | 40,419,483 | Withheld | 7/14/2018 | Colorado Springs, | CO. | 645,613 |
| 40,623,770 | 44,337,750 | Withheld | 7/14/2018 | Raleigh, | NC. | 1,130,490 |
| 39,420,535 | 34,813,032 | Withheld | 7/14/2018 | Portland, | ME. | 514,098 |
| 39,346,411 | 40,463,111 | Withheld | 7/14/2018 | Little Rock, | AR. | 699,757 |
| 37,213,654 | 34,737,864 | Withheld | 7/14/2018 | Navajo Lake, | NM. | Transient |
| 34,744,521 | 34,512,194 | Withheld | 7/14/2018 | Spokane, | WA. | 527,753 |
| 33,224,128 | 20,581,428 | Withheld | 7/14/2018 | Riverside, | CA. | 4,224,851 |
| 33,132,261 | 36,006,654 | Withheld | 7/14/2018 | Worcester, | MA. | 916,980 |
| 32,793,995 | 19,053,349 | Withheld | 7/14/2018 | St. George, | UT. | 138,115 |
| 32,143,606 | 31,374,550 | Withheld | 7/14/2018 | Fresno, | CA. | 930,450 |
| 31,905,007 | 36,471,865 | Withheld | 7/14/2018 | San Diego, | CA. | 3,095,313 |
| 31,134,218 | 28,535,235 | Withheld | 7/14/2018 | Atlanta, | GA. | 5,286,728 |
| 30,861,451 | 29,029,862 | Withheld | 7/14/2018 | Boston, | MA. | 4,552,402 |
| 30,164,668 | 32,427,477 | Withheld | 7/14/2018 | Idaho Falls, | ID. | 133,265 |
| 29,889,133 | 30,305,275 | Withheld | 7/14/2018 | Phoenix, | AZ. | 4,192,887 |
| 29,623,249 | 30,642,624 | Withheld | 7/14/2018 | Los Angeles, | CA. | 12,828,837 |
| 29,482,000 | 29,399,282 | Withheld | 7/14/2018 | Tucson, | AZ. | 980,263 |
| 29,067,521 | 28,446,605 | Withheld | 7/14/2018 | Denver, | CO. | 2,543,482 |
| 28,694,991 | 27,531,758 | Withheld | 7/14/2018 | San Bernardino, | CA. | 4,224,851 |
| 28,371,707 | 28,589,973 | Withheld | 7/14/2018 | Casper, | WY. | 75,450 |
| 27,720,055 | NA | Withheld | 7/14/2018 | Yuma, | AZ. | 195,751 |
| 27,006,881 | 27,126,305 | Withheld | 7/14/2018 | Concord, | NH. | 146,445 |
| 26,800,010 | 26,774,765 | Withheld | 7/14/2018 | Hartford, | CT. | 1,212,381 |
| 26,789,611 | 32,010,659 | Withheld | 7/14/2018 | Grand Junction, | CO. | 146,723 |
| 26,258,135 | 22,897,341 | Withheld | 7/14/2018 | El Paso, | TX. | 622,263 |
| 26,047,816 | Withheld | Withheld | 7/14/2018 | Bakersfield, | CA. | 839,631 |
| 25,923,101 | 24,532,264 | Withheld | 7/14/2018 | Oklahoma City, | OK. | 1,252,987 |
| 25,436,963 | 24,718,359 | Withheld | 7/14/2018 | Providence, | RI. | 1,600,852 |
| 25,100,938 | 23,413,611 | Withheld | 7/14/2018 | Kansas City, | KS. | 2,009,342 |
| 24,924,044 | 24,444,221 | Withheld | 7/14/2018 | Laredo, | TX. | 250,304 |
| 24,472,800 | 25,854,191 | Withheld | 7/14/2018 | Pierre, | SD. | 21,361 |
| 24,063,084 | 25,751,962 | Withheld | 7/14/2018 | Reno, | NV. | 64,511 |
| 23,932,353 | 44,106,369 | Withheld | 7/14/2018 | Billings, | MT. | 158,934 |
| 23,642,426 | 22,950,412 | Withheld | 7/14/2018 | Boise, | ID. | 616,561 |
| 23,635,054 | 24,627,743 | Withheld | 7/14/2018 | Louisville, | KY | 1,235,708 |
| 23,590,944 | 23,047,207 | Withheld | 7/14/2018 | Mason City, | IA. | 51,749 |
| 23,475,896 | 28,482,770 | Withheld | 7/14/2018 | Anaheim, | CA. | 3,010,232 |
| 23,316,509 | 29,692,596 | Withheld | 7/14/2018 | Albuquerque, | NM. | 887,077 |
| 23,024,158 | 20,436,401 | Withheld | 7/14/2018 | New York City, | NY. | 8,175,133 |
| 22,843,311 | 21,493,468 | Withheld | 7/14/2018 | Cleveland, | OH. | 2,077,240 |
| 22,692,010 | 22,244,427 | Withheld | 7/14/2018 | Pittsburgh, | PA. | 2,356,285 |
| 22,492,945 | Withheld | 7/14/2018 | Corpus Christi, | TX. | 428,185 | |
| 22,395,159 | 21,622,913 | Withheld | 7/14/2018 | Shreveport, | LA. | 439,811 |
| 22,327,683 | 23,542,007 | 514,414 | 7/14/2018 | Kearney, | NE. | 52,591 |
| 22,218,760 | 20,404,694 | Withheld | 7/14/2018 | Ft. Smith, | AR. | 280,467 |
| 22,133,037 | 20,640,221 | Withheld | 7/14/2018 | Lincoln, | NE. | 36,288 |
| 22,061,956 | 20,111,909 | Withheld | 7/14/2018 | Wichita, | KS. | 630,919 |
| 21,969,097 | 19,136,704 | Withheld | 7/14/2018 | Bismarck, | ND. | 114,778 |
| 21,905,918 | 21,842,831 | Withheld | 7/14/2018 | Champaign, | IL. | 231,891 |
| 21,676,708 | 22,798,140 | Withheld | 7/14/2018 | Charleston, | WV. | 309,635 |
| 21,464,309 | 22,802,808 | Withheld | 7/14/2018 | Virginia Beach, | VA. | 1,676,822 |
| 21,332,326 | 21,659,146 | Withheld | 7/14/2018 | Salt Lake City, | UT. | 1,087,873 |
| 21,285,573 | 23,351,597 | Withheld | 7/14/2018 | Richland, | WA. | 253,340 |
| 21,158,632 | 19,879,326 | Withheld | 7/14/2018 | Lexington, | KY | 472,099 |
| 21,063,613 | 25,790,099 | Withheld | 7/14/2018 | Rapid City, | SD. | 134,598 |
| 20,923,794 | 20,332,891 | Withheld | 7/14/2018 | Tulsa, | OK. | 937,478 |
| 20,873,018 | 21,850,766 | Withheld | 7/14/2018 | Harrisonburg, | VA. | 125,228 |
| 20,725,721 | 21,196,997 | Withheld | 7/14/2018 | Memphis, | TN. | 1,324,829 |
| 20,381,579 | 20,297,139 | Withheld | 7/14/2018 | Amarillo, | TX. | 251,933 |
| 20,371,311 | 26,003,632 | Withheld | 7/14/2018 | Tallahasee, | FL. | 367413 |
| 19,634,281 | 19,570,249 | Withheld | 7/14/2018 | Omaha, | NE. | 865,350 |
| 19,592,657 | 18,650,416 | Withheld | 7/14/2018 | Lockport, | NY. | 21,165 |
| 19,579,387 | 28,558,227 | Withheld | 7/14/2018 | Augusta, | GA. | 564,873 |
| 19,530,193 | WITHHELD | Withheld | 7/14/2018 | Mobile, | AL. | 412,992 |
| 19,272,651 | 19,613,112 | Withheld | 7/14/2018 | Ft. Worth, | TX. | 6,426,214 |
| 18,972,683 | 17,774,693 | Withheld | 7/14/2018 | Detroit, | MI. | 4,296,250 |
| 18,657,548 | 16,516,044 | Withheld | 7/14/2018 | Carlsbad, | NM. | 53,829 |
| 18,567,458 | 18,633,173 | Withheld | 7/14/2018 | Richmond, | VA. | 1,208,101 |
| 18,304,028 | 16,894,762 | Withheld | 7/14/2018 | Madison, | WI. | 605,435 |
| 18,083,852 | 15,886,080 | Withheld | 7/14/2018 | Des Moines, | IA. | 40,325 |
| 18,002,722 | 15,674,442 | Withheld | 7/14/2018 | Aurora, | IL. | 201,110 |
| 17,601,065 | 18,362,431 | Withheld | 7/14/2018 | Knoxville, | TN. | 837,571 |
| 17,510,475 | 19,136,704 | Withheld | 7/14/2018 | Birmingham, | AL. | 1,128,047 |
| 17,259,932 | 18,516,503 | Withheld | 7/14/2018 | Philadelphia, | PA. | 5,965,343 |
| 16,575,294 | 16,590,947 | Withheld | 7/14/2018 | Eureka, | CA. | 134,623 |
| 16,532,754 | 15,187,228 | Withheld | 7/14/2018 | St. Paul, | MN. | 3,348,859 |
| 16,436,939 | 17,811,900 | Withheld | 7/14/2018 | Chicago, | IL. | 9,461,105 |
| 16,139,576 | 15,331,319 | Withheld | 7/14/2018 | Indianapolis, | IN. | 1887877 |
| 16,006,133 | 18,857,808 | Withheld | 7/14/2018 | San Jose, | CA. | 1,836,911 |
| 15,942,672 | 18,632,046 | Withheld | 7/14/2018 | Montgomery, | AL. | 374,536 |
| 15,647,529 | 16,462,876 | Withheld | 7/14/2018 | Houston, | TX. | 5,920,416 |
| 15,086,399 | 14,591,814 | 272,500 | 7/14/2018 | St. Louis, | MO. | 2,787,701 |
| 14,979,387 | 19,725,444 | Withheld | 7/14/2018 | San Francisco, | CA. | 4,335,391 |
| 14,800,595 | 15,826,171 | Withheld | 7/14/2018 | Baton Rouge, | LA. | 802,484 |
| 14,542,931 | 12,998,453 | 130,057 | 7/14/2018 | Yaphank, | NY. | 5,945 |
| 14,508,399 | 31,762,553 | Withheld | 7/14/2018 | Miami, | FL. | 2,356,285 |
| 13,998,687 | 15,222,750 | Withheld | 7/14/2018 | Dallas, | TX. | 6,426,214 |
| 13,782,142 | 16,449,188 | Withheld | 7/14/2018 | Burlington, | VT. | 211,261 |
| 13,615,608 | 12,412,300 | Withheld | 7/14/2018 | Nashville, | TN. | 1,670,890 |
| 13,094,802 | 14,537,006 | Withheld | 7/14/2018 | Paducah, | KY. | 98,762 |
| 13,025,199 | 11,499,972 | Withheld | 7/14/2018 | Duluth, | MN. | 279,771 |
| 10,908,171 | 21,818,431 | Withheld | 7/14/2018 | Rochester, | NY. | 1,079,671 |
| 10,306,415 | 10,340,912 | Withheld | 7/14/2018 | Tampa, | FL. | 2,783,243 |
| 9,302,571 | 13,360,538 | Withheld | 7/14/2018 | San Antonio, | TX. | 2,142,508 |
| 9,299,825 | 18,138,654 | Withheld | 7/14/2018 | Washington, | D.C. | 6,097,684 |
| 8,684,767 | 9,966,104 | 199,742 | 7/14/2018 | Fairbanks, | AK. | 97,581 |
| 7,557,055 | 7,511,145 | 93,165 | 7/14/2018 | Anchorage, | AK. | 380,821 |
| 5,609,589 | 5,609,589 | 7/14/2018 | MaxNormalSafeLevel | US |
SUBSCRIBE to Million A Week Club Email updates
SHOWSTOPPER
Today’s 195-day or 4,680-hour report for January 1, 2018 to July 14, 2018, is another case of Bad news from your radWeather Report. 53.42% [to July 14] of 2018 is gone.
I won’t try to kid you with good news lies and made up “fake facts.” Bottom-line, this is way too much radiation for humans to take.
I despise the people-like animals responsible for this world wide calamity. I will continue the report as long as I am able.
Continue to read and share as long as you are able. Tell your smart friends; the others, not so much.
Denial is very strong in Americans; expect it often. Don’t let it get you down; there are millions of folks who know the score on the Rad. Persevere.
I will measure and characterize our shared demise to the best of my ability. BookMark this page and Sign up for Emails on my Websites; I’ll keep you advised.
Within minutes or hours of publishing this
Within minutes or hours of publishing this list of cities over 27 Million YTD Counts of Radiation, four more cities will Zoom past 27 Million Counts of deadly Gamma Radiation since January 1, 2018.
Their killer attack on your body’s trillions of cells never ceases. It did not used to be that way y’know – back in the day.
Killer cell assassins, like Plutonium 239, and its brothers were never around. That will be 27 cities above 27 Million Rad Counts so far this year.
Max Normal Safe Level
The United States is a very radioactive country. No monitored cities are below the MaxNormalSafeLevel; all monitored cities are above safe level.
Records of Total Gamma Radiation are easily accessible with a computer and a fast Internet connection at RadNet, a directorate of the EPA. [1]
RadNet simply presents the data. It is up to you to decide how much radiation is too much and what to do about it.
Use a fast InterNet connection or run the look-ups as a background task. Either way, you get the data yourself.
Good luck on your efforts. As they say, “It’s complicated.”
Conclusion. The amount of Rad in the air now Dooms Humanity to a relatively quick Extinction.
Have a wonderful radioactive weekend and remember to Dodge the Rads, it’s dangerous out there.
Resources*
Colorado Springs, CO. Radiation History 2006 – 2017 NEW DATA
2018 Annualized Rate of Gamma Rad: 84,260,289 CPM, an Increase of 44,880CPM since January 1, 2018.
2017 Annual Rad CPM: 84,495,556 CPM Total Gamma Count, Beta Withheld
2016 Annual Rad CPM: 85,154,664 CPM Total Gamma Count, Beta Withheld
2015 Annual Rad CPM: 81,746,223 CPM Total Gamma Count, Beta Withheld
2014 Annual Rad CPM: 77,531,924 CPM Total Gamma Count, Beta Withheld
2013 Annual Rad CPM: 84,817,423 CPM Total Gamma Count, Beta Withheld
2012 Annual Rad CPM: 85,323,100 CPM Total Gamma Count, Beta Withheld
2011 Annual Rad CPM: 78,015,071 CPM Total Gamma Count, Beta Count: 568,266 CPM
2010 Annual Rad CPM: 76,610,646 CPM Total Gamma Count, Beta Count: 598,878 CPM
2009 Annual Rad CPM: 79,872,468 CPM Total Gamma Count, Beta Count: 1,278,274 CPM
2008 Annual Rad CPM: 93,502,028 CPM Total Gamma Count, Beta Count: 2,183,901 CPM
2007 Rad CPM: Zero, Radiation Count Data Not Available to the Public.
2006 Rad CPM: Zero, Radiation Count Data Not Available to the Public.
Total Gamma Radiation Colorado Springs 2006 to 2017: 826,747,236 CPM.
Other Resources: Eco Health Alliance interactive map of killer viruses
Copyright by Bob Nichols © 2018: Reproduce and distribute. Write Bob Nichols at duweapons@gmail.com
Sources, Notes and Recommended Readings
1. The Radiation charts and graphs of the EPA. Individual queries can be built at the EPA RadNet Query Builder
2. The EPA based reporting of NETC dot com, an LLC.
3. These stations’ Radiation equals Total Gamma Radiation. Gamma Radiation Monitors are reporting publicly at all these locations. CPM. “Although we can’t see it, taste it, smell it or hear it we can measure radiation and observe its effects. One way to measure radiation which the United States Environmental Protection Agency [EPA] has chosen to use on its radiation websites is in Counts Per Minute or CPM. Each Count is One Radioactive Decay.” Quote from the ‘Your Radiation This Week’ Apr 3, 2015
4. Radiation destruction of chitin, IAEA, by Ershov, B.G.; Sukhov, N.L.; Nud’ga, L.A.; Baklagina, Yu.G.; Kozhevnikova, L.G.; Petropavlovskii, G.A. (Institute of Physical Chemistry, Moscow (Russian Federation)
5. “Plutonium Air” by Dr Paolo Scampa, AIPRI Blog, Aug 19, 2016
6. “Radioactive Fertilizer,” AIPRI by Dr Paolo Scampa, September 23, 2016, AIPRI: Les engrais radioactifs,
7. “Texas has highest maternal mortality rate in developed world, study finds,” By ABBY GOODNOUGH OCT. 19, 2016,
8. EPA Proposal Allows Radiation Exposure in Drinking Water Equivalent to 250 Chest X-Rays a Year
“Forty-five (45) years later, the Nuclear States officially raise the amounts of “permitted radiation levels” by hundreds and sometimes thousands of times to maintain the utter and absolute dominance of the Nuclear State over everything, everywhere, for all time. No tolerance given.”
9. “Baghdad” by Dr. Paolo Scampa, AIPRI, Saturday 12 November 2016
10. “News Release, New Aerial Survey Identifies More Than 100 Million Dead Trees in California, ” USDA Office of Communications, “This brings the total number of dead trees since 2010 to over 102 million,”
11. Caribou herd in Alaska suffering from mysterious decline, November 30, 2016, Noel Kirkpatrick, MNN Mother Nature Network, “The Central Arctic caribou herd in Alaska is experiencing a “steep decline” in its population, and scientists are researching the reasons why () .”
12. “Facing a Dying Nation,” a line from the 1979 Tribal Rock Musical HAIR. A scene with “Facing a Dying Nation” starring Treat Williams from the movie is here: The character Pfc. Berger is KIA in Vietnam in 1968.
13. It is Eugen Wigner’s name as a Verb. It’s about all things Wignerized. See Notes on Your Radiation This Week No. 69 and 70
14. sie·vert, ˈsēvərt/, noun Physics, noun: sievert; plural noun: sieverts; symbol: Sv, the SI unit of dose equivalent (the biological effect of ionizing radiation), equal to an effective dose of a joule of energy per kilogram of recipient mass. Google: Sievert
15. Eco Health Alliance interactive map of killer viruses – map
16. “In [a] first, government and Tepco found liable for Fukushima disaster,” by Daisuke Kikuchi, “Maebashi, Gunma Pref. In first, government and Tepco found liable for Fukushima disaster,”
17. Uranium Stocks, “Westinghouse Files for Bankruptcy, in Blow to Nuclear Power,” Wednesday, March 29, 2017 at 10:04PM, “Westinghouse Electric Company, which helped drive the development of nuclear energy and the electric grid itself, filed for bankruptcy protection on Wednesday, casting a shadow over the global nuclear industry.
18. Black Star shows tracks of Alpha particles in an Apes lung much like yours. Plutonium particle in lung tissue: “The black star in the middle of this picture shows the tracks made by alpha rays emitted from a particle of plutonium-239 in the lung tissue of an ape. The alpha rays do not travel very far, but once inside the body, they can penetrate more than 10,000 cells within their range. This set of alpha tracks (magnified 500 times) occurred over a 48-hour period” (Robert Del Tredici, At Work in the Fields of the Bomb [1987], plate 39). 19
19. “De la guerre nucléaire” Maurice, E. ANDRE, nuclear officer (NBCR or nuclear, biological, chemical and radiological exclusive function) Captain Commander, retired. Addendum by Dr. Paolo Scampa.
20. University of Arkansas disposes of wastewater
21. Banner picture by the NY Times. Fire
22. Total Gamma Radiation – Year to Date 2017.7 November 18, 2017, VeteransToday. Here.
23. 30 year old radioactive dead tree at Chernobyl. Very dead. Very radioactive, like millions of others there and around the world. https://outoftheboxscience.com/wp-content/uploads/2016/10/Chernobyl-Dead-Trees-Photo-By-Beatrice-Lundborg
24. Amusing Planet, VIP observers watching the spectacle during Operation Greenhouse at Enewetak Atoll, 1951. http://www.amusingplanet.com/2008/07/how-to-watch-nuclear-explosion.html
25. Al Gore Lied, The United States National Aeronautics and Space Administration (NASA) lowers the Boom on Al Gore’s Big Lie that the humble, beneficial gas – CO2 – causes global warming https://www.veteranstodayarchives.com/2013/06/28/al-gore-lied/
26. Did you ever think how much Rad U235 or Rad Plutonium 239 is vaporized in a detonation of a nuclear weapon? Bob Nichols, June 11, 2017. Very little, actually. https://yourradiationthisweek.org/2017/06/11/did-you-ever-think-how-much-rad-u235-or-rad-plutonium-239-is-vaporized-in-a-detonation-of-a-nuclear-weapon/
27. CPM or Counts per Minute is the radiation measuring system used by RadNet, a directorate of the EPA.
28. See the Wind flow! “This map shows you the delicate tracery of wind flowing over the US.” FERNANDA VIÉGAS MARTIN WATTENBERG, See the moving map showing the wind. http://hint.fm/wind/
29. MILLION A WEEK CLUB No 6 – California’s Boosted Fires, By Bob Nichols, December 30, 2017 https://veteranstoday.com/2017/12/30/million-a-week-club-no-6-californias-boosted-fires/

Bob is a long-standing senior fellow with VT Foreign Policy since 2010. He is also a Project Censored Award winner, a former correspondent for the San Francisco Bay View newspaper, and a frequent contributor to various online publications.
He reports on war, politics, and the two nuclear weapons labs in the Bay Area. Nichols is writing a book based on 20 years of nuclear war in Central Asia. He is a former employee of an Army Ammunition Plant.
Follow Bob on his YouTube channel, Nichols on Nuclear, Twitter, and visit his website YourRadiationThisWeek.org.
You are encouraged to write Nichols at duweapons@gmail.com –
Visit Bob Nichol’s Latest Posts, Archives (2010-2015) – Archives (2016-2022)
ATTENTION READERS
We See The World From All Sides and Want YOU To Be Fully InformedIn fact, intentional disinformation is a disgraceful scourge in media today. So to assuage any possible errant incorrect information posted herein, we strongly encourage you to seek corroboration from other non-VT sources before forming an educated opinion.
About VT - Policies & Disclosures - Comment Policy


